Find where the damage is concentrated before every circuit has been walked.
Storm Grid Damage compares imagery of your service territory from before and after the storm pass and flags the zones where the change is concentrated, so the first crew assignments don't rest on trouble tickets alone.
- GSD
- ≤0.5 m (VHR)
- Cadence
- Event-driven
- Platform
- VHR satellite / aerial
- Spectral
- RGB
- Reported by
- Feeder or zone
01The job today
What the restoration sequence rests on
The storm passes at night. By morning the outage management system is full of trouble tickets, the damage assessors are out patrolling feeders, and mutual-aid crews are arriving at the staging area with trucks that need an assignment. The restoration coordinator has to say where they go first.
Tickets are the best signal there is, and they are lopsided. A dense subdivision lights up the board. A rural feeder with few customers, where the road is blocked by a fallen tree and the line that feeds the whole circuit is on the ground, may show a handful of calls or none. Assessors can't reach everywhere at once, and every road that's closed adds hours before someone can report back. So the first sequence gets built from partial information, and the crews you did not send to the quiet zone are the ones that were needed there.
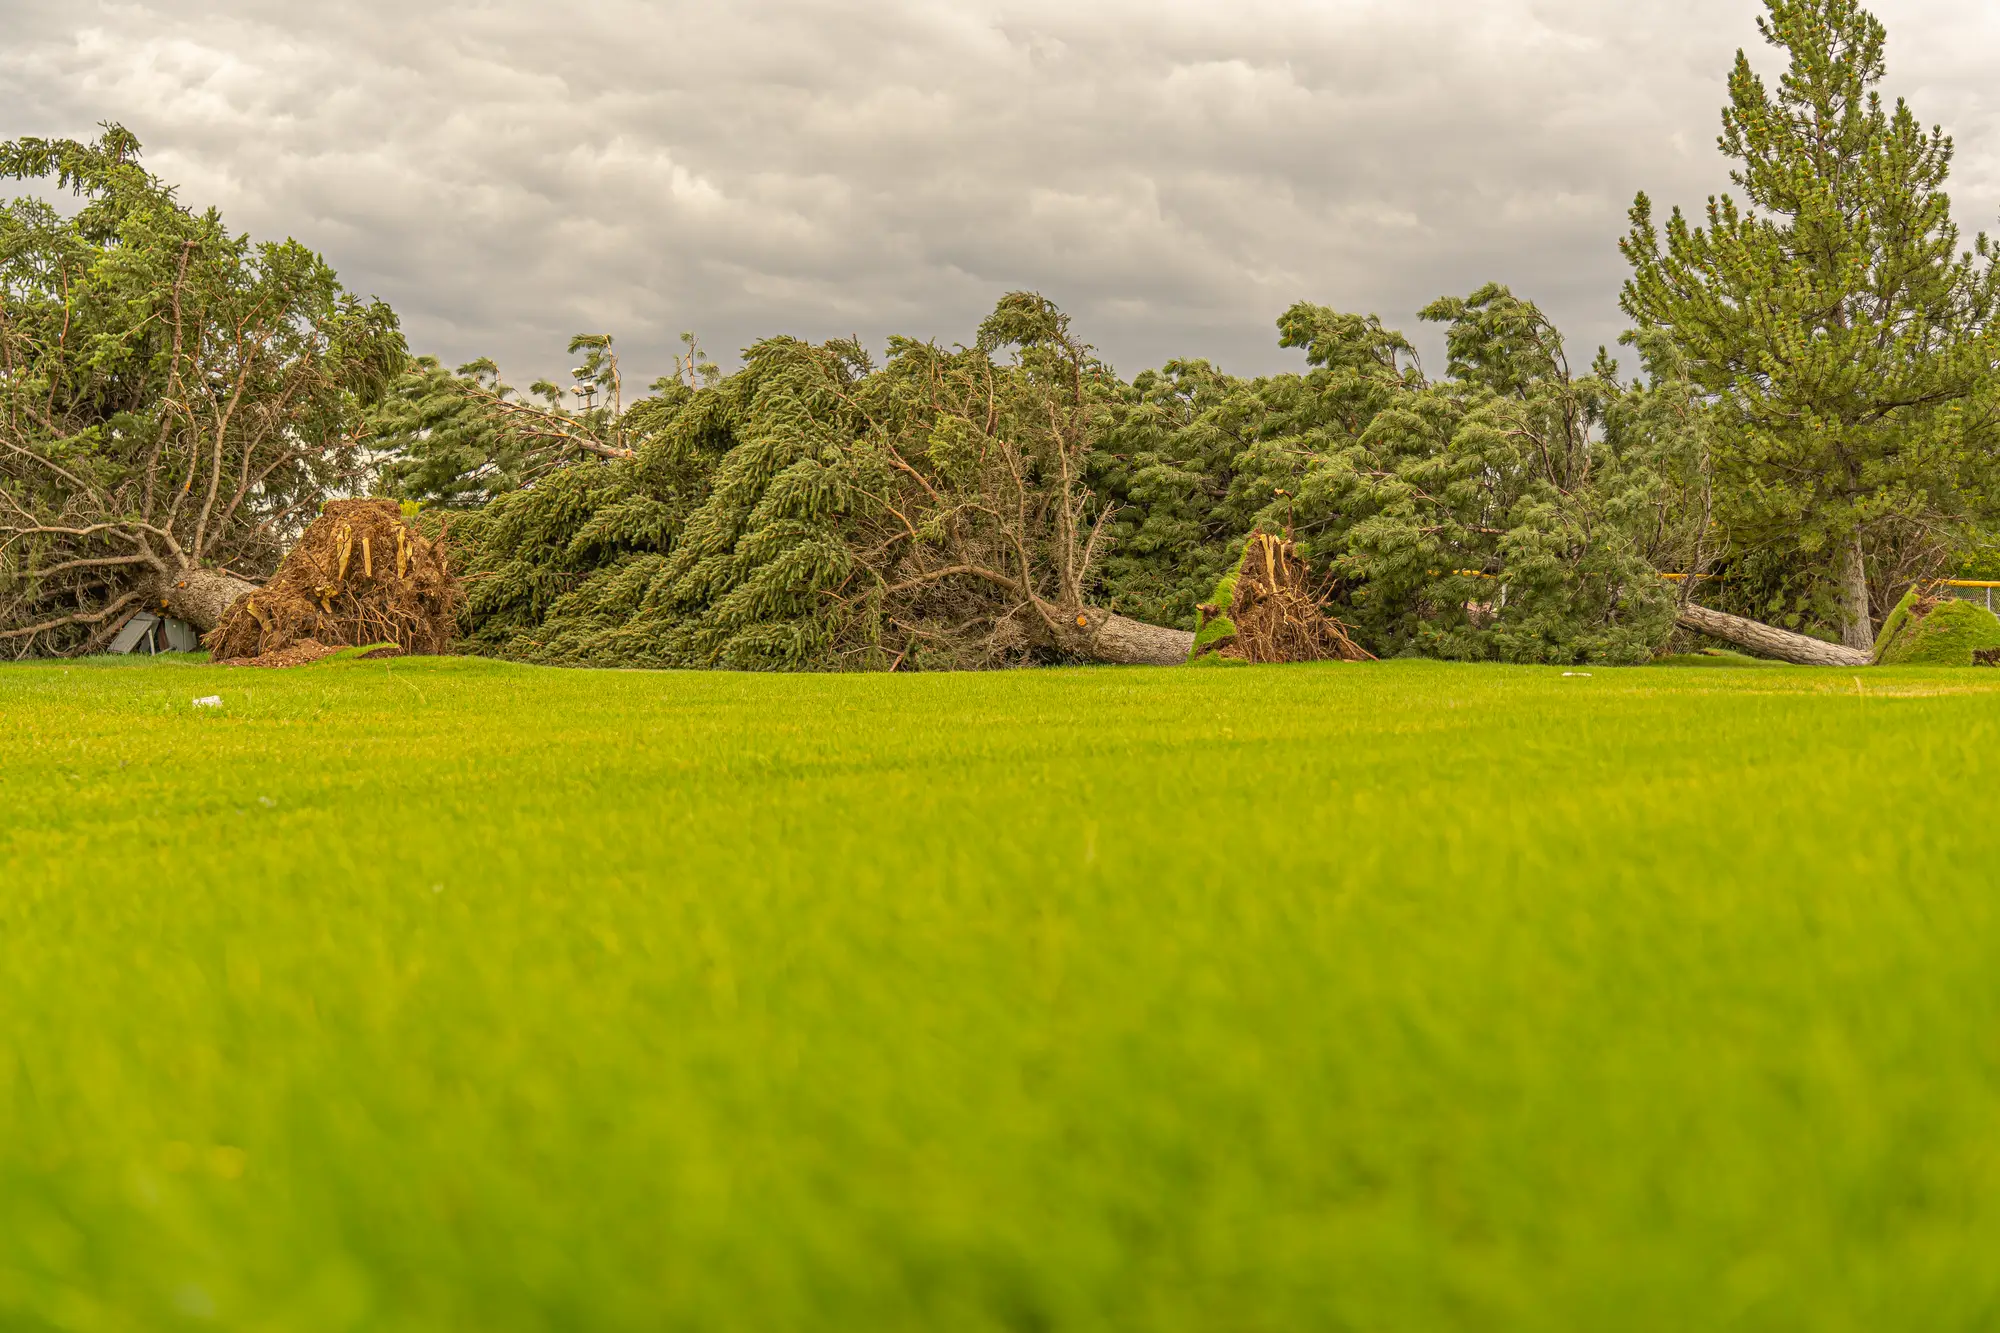
The damage that matters is often the damage nobody has called in yet. Weather on the day makes it worse: you can't see much through a line of storms, and the ground is not passable until it clears.
This is where a before and after comparison helps. Imagery of the territory taken ahead of the season, set against a pass taken once the sky clears, shows what the storm did to the ground: downed trees, debris fields, roofs gone, water where there wasn't any. Mapped across the whole territory, those changes show where to send people first. It is one more input for the coordinator, next to tickets and the assessors' reports.
02What you get
What comes back from a storm pass
On a pilot, it covers the territory, or the part of it, that you set up in advance.
2.1Territory damage-concentration mapGIS layer
Flags across your service territory where the pre/post comparison shows concentrated change. You open it in your own GIS next to your circuit and feeder layers.
2.2Zone rankingRanked list
Zones ordered by how much change was flagged in each, for the coordinator building crew assignments. It is a starting order for the meeting, and the field reports still change it.
2.3Change layerPre and post
The comparison itself, so an analyst or an assessor can look at what was flagged and see the before and after side by side, instead of taking the ranking on trust.
2.4Feeder and zone exportCSV
The ranking as a spreadsheet keyed to your feeder or zone reference, so it can be pasted into the crew assignment sheets or joined to outage data.
03
How it works
Territory and baseline
You send your service territory boundary and, if you keep one, your circuit or zone layer. We capture or line up the pre-event baseline over it before any storm. This step comes first because without it there is nothing to compare against.
Storm pass
When an event hits, the post-event pass is tasked as soon as conditions allow. If rain or cloud is still sitting on the territory, the pass waits for a usable window.
Comparison
The post-event pass is set against the baseline, and zones with concentrated change are flagged.
Delivery
The map, the change layer, the ranked list and the CSV go to you as the imagery becomes usable. You hand the ranking to the coordinator and the planning section.
04Where it fits in your workflow
Alongside the trouble-ticket board
Read it with the outage management system open. Where the tickets and the map agree, you have a good reason to send crews there first. Where the map flags a zone the board is quiet on, send an assessor to look before you commit a mutual-aid crew, since a flag means the ground looks different there, which is short of proof that a line is down.
Field damage assessment carries on as it does today. Individual pole and conductor failures are found on the ground, and incident command still owns the sequence.
05
Limits
L1A baseline has to exist
The comparison only works if pre-event imagery of the territory is on file before the storm. Without it, there is nothing to compare against, and we can't build one after the event.
L2No promised delivery time
Tasking depends on satellite and aircraft availability and on the weather clearing. We don't promise a delivery time after any event, and this page is not an SLA.
L3Weather delays the pass
Optical imagery can't see through cloud or rain. A storm that lingers pushes the pass later. A late pass is still useful once conditions clear, as long as the ground has not been cleared in the meantime.
L4Zones, not assets
At 0.5 m a pixel is wider than a wire and a pole is smaller than a pixel. The flags show concentrations of change across a zone or feeder area. They do not show a broken crossarm, a downed conductor or a failed pole.
L5Change is not always damage
Construction, floodwater that was already there, leaf-off and seasonal change all show up in a comparison. Flags are places to look, and some will turn out to be nothing.
L6A ranking is not an outage map
The output says nothing about whether a circuit is de-energized. It doesn't replace outage data, field damage assessment or incident command judgment.
06
Who it's for
For
- Restoration coordinators and planning section staff who assign crews, including mutual-aid crews, after a storm
- Emergency preparedness and storm-response managers who set up the baseline and the pilot ahead of the season
- Distribution operations leads who want a territory-wide view next to the trouble-ticket board
Not for
- Anyone wanting individual pole, line or transformer failures pinpointed
- A replacement for field damage assessment or patrols
- A promised time to imagery during an active event
- Utilities with no pre-event baseline and no time to set one up before the next storm
07FAQ
Questions before a pilot
How fast after the storm can you deliver?
We can't give a time. The pass is event-driven and depends on imagery availability and the weather clearing. A later pass is still useful once the territory is visible.
Does this replace field damage assessment?
No. It helps you decide where the first assessors and crews go. The assessment itself still happens on the ground.
What if it's still raining or cloudy after the storm?
The pass waits for a usable window. Optical imagery can't see through cloud, so a delay is part of how this works.
Do we need a baseline on file?
Yes, before the event. Ask about baseline setup when you start a pilot, and ideally do it well ahead of the season.
Can it show which poles or lines are down?
No. It flags concentrations of change across zones and feeder areas. Line and pole failures are found by your assessors.
How do we check it against our own damage records?
After an event, compare the flagged zones with your assessors' findings and the trouble-ticket board. Tell us which storm to look back at and what you recorded, and you can judge whether the ranking would have helped your sequence.
Will it fit our GIS and crew assignment sheets?
It comes as a GIS layer plus a CSV keyed to your feeder or zone reference. We don't write into your outage management system.
Who owns the results and the imagery?
We'll confirm ownership and licence terms for the deliverables and the imagery with you before anything is ordered. Ask early if your legal team needs to review.
How is a pilot bought and priced?
Pricing is set when the pilot is scoped, so we don't quote it here. Tell us how your utility buys outside services and we'll scope the pilot to fit.
Set up the baseline before the next event.
Tell us the territory you'd cover and when your storm season starts. We'll say what a pilot would need in place first.
Start a pilot